by Francesco Anselmo and John Mardaljevic
Astronomers and scientists have told us for some considerable time about the angle of the Earth’s axis to the sun, the direction and speed of rotation of our planet, the characteristic irregular distribution of land masses and oceans that defines our geographic knowledge.
Sixty years of space exploration and the images sent by a constantly increasing number of artificial satellites (there are more than 3,000 currently in orbit around the Earth) have strongly ingrained in our personal and collective memory the emotional view of our blue planet from space. But the experience of life on Earth is still perceived from the vantage point of space travellers confined on the thin crust of a planet orbiting at the average speed of 107,200 km/h around a yellow dwarf star, the Sun.
The rotation of the Earth around its axis defines the sequence of light and darkness on the surface, creating the concepts of day and night. The light of the day becomes what we humans call daylight.
Daylight is composed of the light of the sun (small directional source) and the light of the sky (large diffuse source). Skylight is sunlight that is scattered by the air – without an atmosphere, the daytime sky would be black, as it is on the Moon.
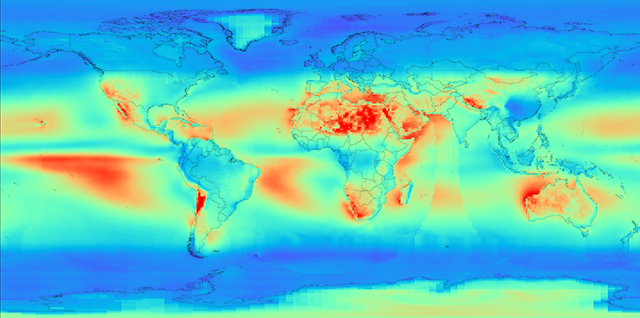
The surface of the Earth (with its materials, orography and vegetation, but also with the results of anthropic activities) interacts with the energy from the Sun, creating different events in the atmosphere that, in the long term, characterise the local climate and with it also the luminous climate, that is the climate that interacts with visual perception.
The need to understand and predict weather, mainly for agricultural and socio-economic reasons, has developed climate science and created a network of weather stations that sense, log and monitor a number of environmental variables on the ground. Stationary satellites have also been deployed to gather weather patterns remotely, allowing us to extrapolate the ground readings, with good accuracy, to any location on Earth.
These data can be filtered statistically and visualised to give an insight on the global climate history and future trends.
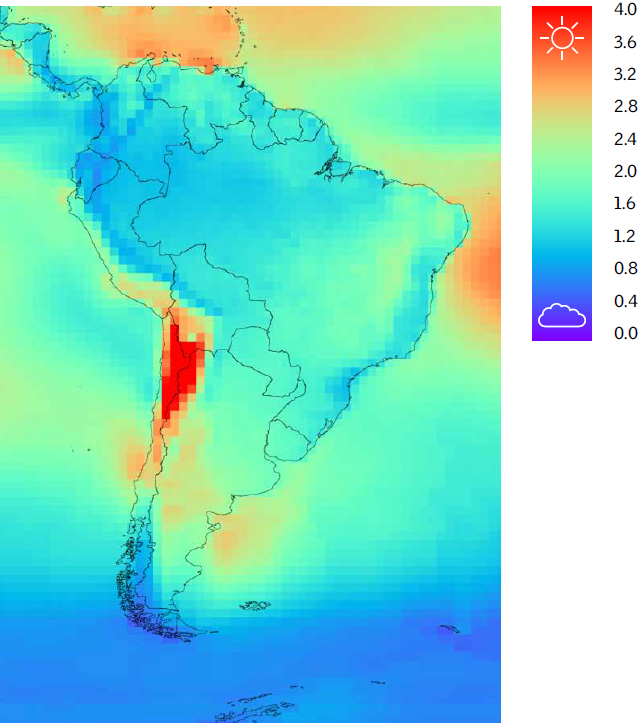
| Direct-to-diffuse irradiation ratio in South America. The map clearly shows how isolated the climate of Chile is from the rest of the continent, and what differences exist between the dry north and the humid, cold south. |
Read the full article on DA.VELUX.com.


